实例模板
应用:大屏项目二次开发
模板路径:应用空间- 地铁
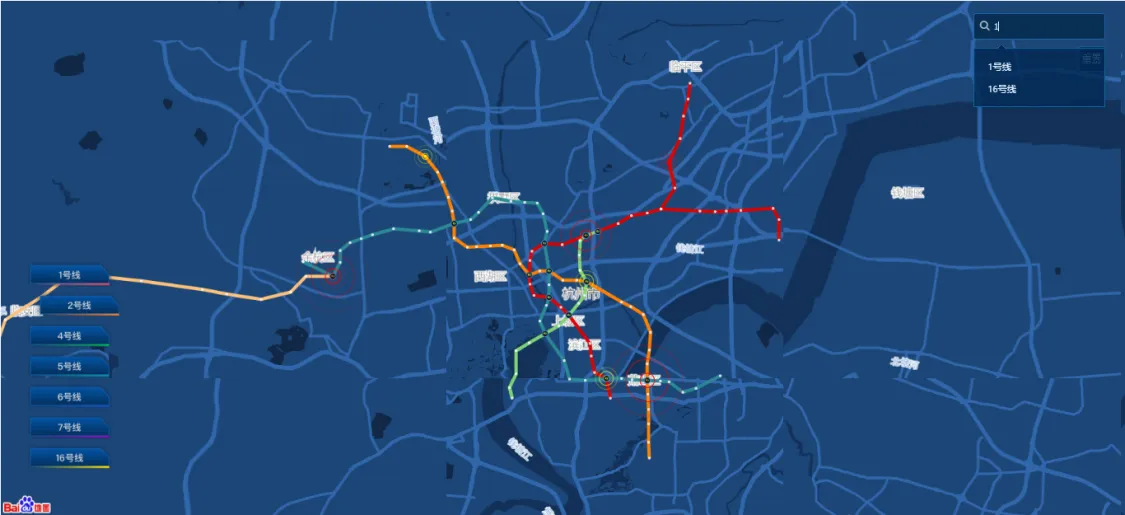
1、预览效果

2、实现原理
基于乐创者报表(lczReport)中单元格的自定义控件功能+echarts实现。
3、配置步骤
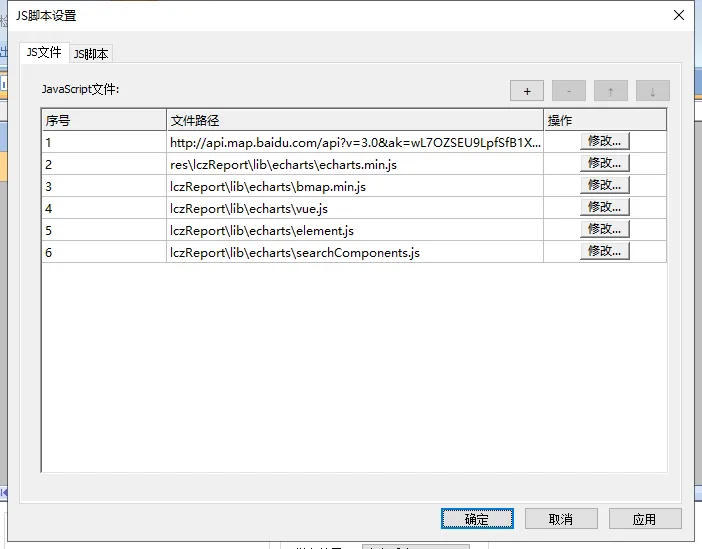
3.1、引入echarts等js文件(按顺序引入js)
http://api.map.baidu.com/api?v=3.0&ak=wL7OZSEU9LpfSfB1Xwi0MbKxXkMVBn2X&callback=baiducallback
3.2、报表模板中设置自定义控件
3.3、配置脚本
ER.widget.extend(this, {
type: 'echarts',
init: function (datas, element, echarts) {
myChart = echarts.init(element);
var legendData = [{
name: '1号线'
}, {
name: '2号线'
}, {
name: '4号线'
}, {
name: '5号线'
}, {
name: '16号线'
}]
function handleSelectSearch(value) {
if (value['type'] == 'station') {
to(value['lan'], value['lat']);
var seriesIndex;
var dataIndex;
for (let i = 0; i < option.series.length; i++) {
const element = option.series[i];
if (element.type == "scatter") {
for (let j = 0; j < element.data.length; j++) {
const data = element.data[j];
if (data[3] == value.value) {
seriesIndex = i;
dataIndex = j;
}
}
}
}
myChart.dispatchAction({
type: 'showTip',
seriesIndex: seriesIndex,
dataIndex: dataIndex,
name: value.val,
position: "top"
})
} else if (value['type'] == 'all') {
for (let i = 0; i < legendData.length; i++) {
const element = legendData[i];
myChart.dispatchAction({
type: 'legendSelect',
name: element.name
})
}
option.bmap.center = [120.2, 30.28]
option.bmap.zoom = 12
myChart.setOption(option);
} else {
for (let i = 0; i < legendData.length; i++) {
const element = legendData[i];
// debugger
if (element.name == value.value) {
myChart.dispatchAction({
type: 'legendSelect',
name: value.value
})
} else {
myChart.dispatchAction({
type: 'legendUnSelect',
name: element.name
})
}
option.bmap.center = [120.2, 30.28]
option.bmap.zoom = 12
myChart.setOption(option);
}
}
}
window.handleSelectSearch = handleSelectSearch
let routeList = datas.content.route.reduce((pre, cur) => {
if (!pre.includes(cur)) {
return pre.concat(cur)
} else {
return pre
}
}, [])
console.log(routeList)
var colors = {
"1": 'rgb(221,4,3)',
"2": 'rgb(255,128,0)',
"5": "rgb(43,138,150)",
"4": "rgb(127,210,117)",
"16": "rgb(253,192,123)"
}
$('<div id="search"></div>').insertAfter(element);
$('<div class="reset">重置</div>').insertAfter(element);
searchFilterFunc(datas.content, routeList)
$(".reset").click(function () {
for (let i = 0; i < legendData.length; i++) {
const element = legendData[i];
myChart.dispatchAction({
type: 'legendSelect',
name: element.name
})
}
option.bmap.center = [120.2, 30.28]
option.bmap.zoom = 12
myChart.setOption(option);
})
option = {
bmap: {
center: [120.2, 30.28],
zoom: 12,
roam: true,
// mapStyle: {
// "styleJson": styleJson
// },
mapStyleV2: {
"styleJson": styleJson
},
enableMapClick: false
},
legend: {
show: false,
lineStyle: {
color: ['rgb(221,4,3)', 'rgb(255,128,0)', "rgb(127,210,117)", "rgb(43,138,150)", "rgb(253,192,123)"]
},
data: legendData,
textStyle: {
color: '#fff'
},
},
tooltip: {
show: true,
// alwaysShowContent: true,
formatter: function (params) {
let str = ''
str +=
"<div class=box>" +
"<div class=angle></div>" +
"<div class=head-line>" + params.data[3] + "</div>" +
"<div class=content>" + "</div>"
"</div>"
// return params.data[3] + ":" + params.data[2]
return str
},
// backgroundColor: 'rgba(19,48,91,0.5)',
backgroundColor: 'rgba(19, 48, 91, 0.8)',
// borderColor: '#000816',
borderWidth: 0,
padding: 0,
// triggerOn: 'mousemove'
},
series: []
}
var content = datas.content;
var lineObj = {};
var routeNumber = 1;
var li = []
for (let i = 0; i < content.serial_number.length; i++) {
const station_name = content.station_name[i],
station_type = content.station_type[i],
route = content.route[i],
lat = content.latitude[i], // 纬度
lng = content.longitude[i]; // 经度
man_count = content.man_count[i],
info = content.Site_location_information[i];
var ret = gcj02tobd09(lng, lat)
if (route == routeNumber) {
li.push({
station_name: station_name,
lat: ret[1],
lng: ret[0],
man_count: man_count,
station_type: station_type,
info: info
})
} else {
li = [];
li.push({
station_name: station_name,
lat: ret[1],
lng: ret[0],
man_count: man_count,
station_type: station_type,
info: info
})
}
routeNumber = route;
lineObj[route] = li;
}
for (const key in lineObj) {
let k;
if (key == 0) {
k = 1
} else {
k = key
}
let linesObj = {
type: 'lines',
name: k + '号线',
coordinateSystem: 'bmap',
polyline: true,
data: [],
silent: true,
lineStyle: {
color: colors[k],
opacity: 1,
width: 5
},
emphasis: {
label: {
show: true
}
},
progressiveThreshold: 500,
progressive: 200
}
let vauleList = [];
for (let j = 0; j < lineObj[key].length; j++) {
let posList = []
const element = lineObj[key][j];
posList.push(element["lng"])
posList.push(element["lat"])
vauleList.push(posList);
}
linesObj.data.push({
coords: vauleList
})
option.series.push(linesObj);
// 普通
let obj = {
coordinateSystem: "bmap",
name: k + "号线",
type: "scatter",
symbol: "circle",
symbolSize: 4,
data: [],
itemStyle: {
color: "white"
},
label: {
show: false,
color: '#B7D8FF',
fontSize: 10,
formatter: function (params) {
return params.data[3]
},
offset: [10, -20]
},
emphasis: {
label: {
show: false
}
},
}
// 红色涟漪
let obj2 = {
coordinateSystem: "bmap",
name: k + "号线",
type: "effectScatter",
symbol: "circle",
symbolSize: 4,
rippleEffect: {
brushType: 'stroke'
},
data: [],
itemStyle: {
color: 'red',
shadowColor: "IndianRed",
shadowBlur: 20
},
label: {
show: false,
color: '#B7D8FF',
fontSize: 10,
formatter: function (params) {
return params.data[3]
},
offset: [10, -20]
},
emphasis: {
label: {
show: true
}
},
}
// 黄色涟漪
let obj3 = {
coordinateSystem: "bmap",
name: k + "号线",
type: "effectScatter",
symbol: "circle",
symbolSize: 4,
rippleEffect: {
brushType: 'stroke'
},
data: [],
itemStyle: {
color: 'yellow',
shadowColor: "Gold"
},
label: {
show: false,
color: '#B7D8FF',
fontSize: 10,
formatter: function (params) {
return params.data[3]
},
offset: [10, -20]
},
emphasis: {
label: {
show: true
}
},
}
// 换乘站
let obj4 = {
coordinateSystem: "bmap",
name: k + "号线",
type: "scatter",
symbol: pic,
symbolSize: 10,
data: [],
label: {
show: false,
color: '#B7D8FF',
fontSize: 10,
formatter: function (params) {
return params.data[3]
},
offset: [10, -20]
},
emphasis: {
label: {
show: true
}
},
}
for (let j = 0; j < lineObj[key].length; j++) {
const element = lineObj[key][j];
let vauleList = []
vauleList.push(element["lng"])
vauleList.push(element["lat"])
vauleList.push(element["man_count"])
vauleList.push(element["station_name"])
if (element['man_count'] > 15) {
obj2.data.push(vauleList)
obj2.rippleEffect['scale'] = element['man_count'] / 1.5
} else if (element['man_count'] > 14 && element['man_count'] <= 15) {
obj3.data.push(vauleList)
obj3.rippleEffect['scale'] = element['man_count'] / 1.5
} else if (element['man_count'] == 'undefined') {
continue
} else {
obj.data.push(vauleList);
}
if (element['station_type'].indexOf("换乘站") != '-1') {
obj4.data.push(vauleList)
}
}
option.series.push(obj);
option.series.push(obj2);
option.series.push(obj3);
option.series.push(obj4);
}
myChart.setOption(option);
$('<div class="subway"></div>').appendTo(element)
$('<button class="spansubway line1" value=1></button></br>').appendTo($('.subway'))
$('<button class="spansubway line2" value=2></button></br>').appendTo($('.subway'))
$('<button class="spansubway line4" value=4></button></br>').appendTo($('.subway'))
$('<button class="spansubway line5" value=5></button></br>').appendTo($('.subway'))
$('<button class="spansubway line6" value=6></button></br>').appendTo($('.subway'))
$('<button class="spansubway line7" value=7></button></br>').appendTo($('.subway'))
$('<button class="spansubway line16" value=16></button></br>').appendTo($('.subway'))
var that = this;
$('.spansubway').click(function () {
$(this).siblings().css({
"left": 0
})
$(this).css({
"left": "10%"
})
var val = $(this).val()
var variants = [{
name: '线路',
value: val
}]
that.handleLink('Link1', variants)
})
//监听缩放事件
function listenerZoom() {
myChart.on("bmaproam", params => { //这里是bmaproam方法,其余都一样
let _option = myChart.getOption();
let _zoom = _option.bmap[0].zoom;
for (let i = 0; i < _option.series.length; i++) {
const element = _option.series[i];
if (element.type != 'lines') {
if (_zoom < 13) {
element.label.show = false;
} else {
element.label.show = true;
}
}
}
myChart.setOption(_option)
});
}
listenerZoom();
function to(x, y) {
option.bmap.center = [x, y]
option.bmap.zoom = 15
myChart.setOption(option);
};
}
})作者:倪 创建时间:2024-07-24 10:25
最后编辑:倪 更新时间:2025-09-11 14:02
最后编辑:倪 更新时间:2025-09-11 14:02
 扫码关注网盛数新公众号,获取更多帮助资料
